 for transformer insulation testing, moisture detection and predictive maintenance.)
 Testing of Power Transformers")
What is DFR analysis in Dielectric Frequency Response?
Dielectric Frequency Response Analysis (DFR) which is also known as Frequency Domain Spectroscopy (FDS) (or) Dielectric Response Analysis (DRA) is an advanced diagnostic test used to assess the insulation condition of oil filled power transformers.
- What is DFR analysis in Dielectric Frequency Response?
- Effects of Moisture on Transformer Insulation
- 1). Decrease in Dielectric Strength
- 2). Accelerated Aging of Insulation
- 3). Bubble Formation at High Temperature
- 4). Increased Dielectric Losses
- 5). Increased Risk of Internal Faults
- Purpose of Dielectric Response Analysis
- Objective
- 1). Moisture Assessment in Cellulose Insulation
- 2). Evaluation of Insulation Condition
- 3). Maintenance and Asset Management
- Importance of Moisture Detection in Transformers
- Principle of Dielectric Frequency Response Analysis
- Frequency Range used in DFR Test
- Test Equipment
- Applicable Standards
- Test Connections
- Step-by-Step Test Procedure
- Step-1: Transformer Preparation
- Step-2: Connect Measurement Equipment
- Step-3: Guard Cable Connection
- Step-4: Perform Frequency Sweep
- Step-5: Record Dielectric Response Curve
- Step-6: Temperature Measurement
- Test Overview
- 1). Frequency Domain Spectroscopy (FDS)
- 2). Polarization Depolarization Current (PDC)
- Interpretation of Dielectric Response Curve
- Moisture Calculation
- Reporting
- Template
- Summary
This test is especially effective in determining the moisture content in cellulose insulation (paper insulation) and evaluating the overall health of the transformers insulation system.
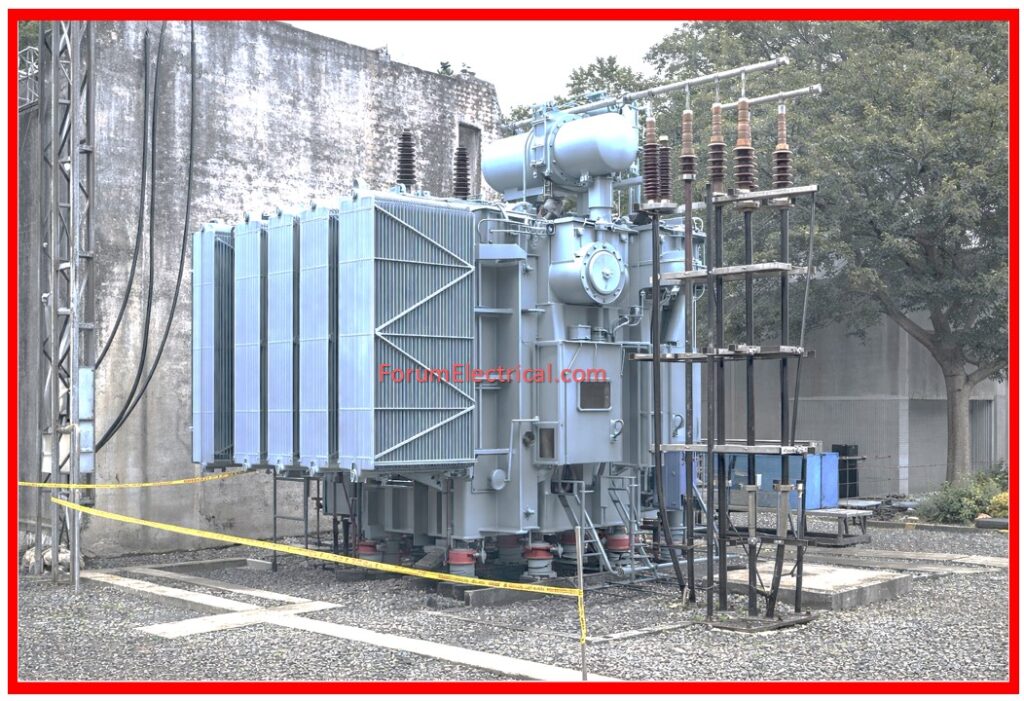
The insulation system of a transformer mainly consists of:
1). Cellulose insulation (paper & pressboard)
2). Transformer insulating oil
These 2 materials together form the dielectric insulation between windings and between windings and ground.
Over a period of time, moisture, aging and contamination degrade the insulation performance.
Dielectric Response Analysis helps to detect these issues accurately without dismantling the transformer.
This test is widely used for:
• Condition assessment of power transformers.
• Remaining life estimation.
• Maintenance planning.
• Preventive maintenance programs.
Effects of Moisture on Transformer Insulation
Moisture can causes serious deterioration in the insulation performance.
1). Decrease in Dielectric Strength
Moisture reduces the insulation withstand capability which is increasing the risk of dielectric failure.
2). Accelerated Aging of Insulation
Moisture accelerates the cellulose decomposition reducing transformer life.
3). Bubble Formation at High Temperature
At high temperatures moisture vaporizes & used to form bubbles inside the insulation.
These bubbles can cause internal flashover and catastrophic failure.
4). Increased Dielectric Losses
Moisture increases power factor (tan δ) resulting in higher dielectric losses.
5). Increased Risk of Internal Faults
Moisture weakens the insulation and increases the risk of
• Winding-to-winding faults and
• Winding-to-ground faults.
Purpose of Dielectric Response Analysis
The primary purpose of Dielectric Frequency Response Analysis (DFRA) is to determine the moisture content in cellulose insulation and determine the insulation condition of the transformer.
Objective
1). Moisture Assessment in Cellulose Insulation
Cellulose insulation is highly hygroscopic and absorbs the moisture over time.
Even a small amounts of moisture significantly affect the insulation strength.
DFR provides the accurate moisture percentage (%) in paper insulation.
2). Evaluation of Insulation Condition
DFR helps to identify:
• Insulation aging,
• Oil contamination,
• Insulation degradation &
• Conductivity changes in insulation.
3). Maintenance and Asset Management
The test helps utilities and maintenance engineers to decide:
• Whether drying of insulation is required.
• Transformer condition (Good / Moderate / Poor).
• Remaining service life.
Importance of Moisture Detection in Transformers
Moisture is one of the most dangerous contaminants in transformer insulation.
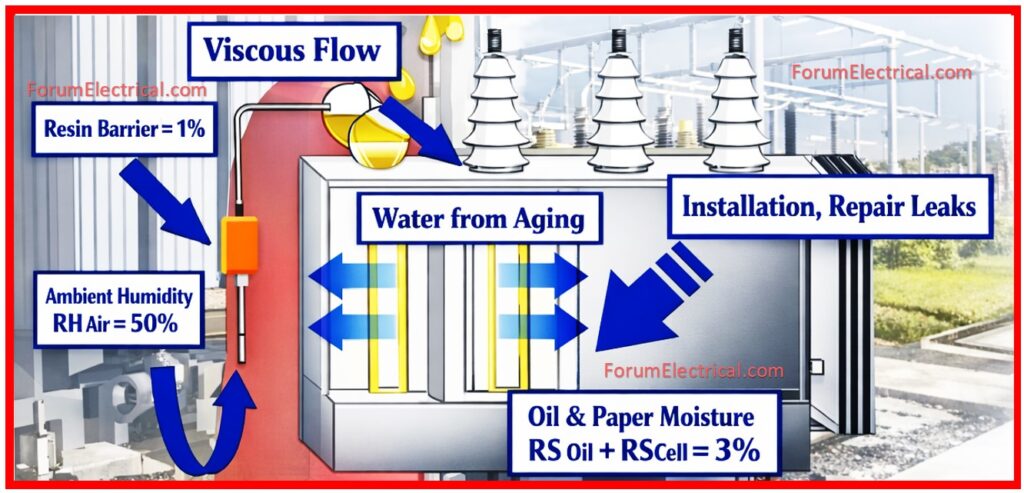
It may enter into the transformer due to:
• Sources of Moisture,
• Aging of cellulose insulation,
• Leaky seals & gaskets,
• Breather malfunction,
• Improper maintenance,
• Oil contamination &
• Atmospheric moisture ingress.
Principle of Dielectric Frequency Response Analysis
Dielectric Response Analysis used to measures insulation response over a wide frequency range to evaluate the insulation properties.
The test measures:
• Capacitance,
• Power Factor (Tan Delta),
• Dissipation Factor &
• Polarization and Depolarization currents.
These values vary with the frequency and provide information about:
• Moisture content in the cellulose insulation,
• Oil conductivity &
• Insulation aging condition.
Frequency Range used in DFR Test
Typical frequency range is:
0.0001 Hz to 1000 Hz
Different frequency ranges provide different information as
| Frequency Range | Information Obtained |
|---|---|
| Very Low Frequency | Moisture in solid insulation |
| Mid Frequency | Oil conductivity |
| High Frequency | Oil and geometric capacitance |
Test Equipment
• OMICRON DIRANA – Dielectric Response Analyzer
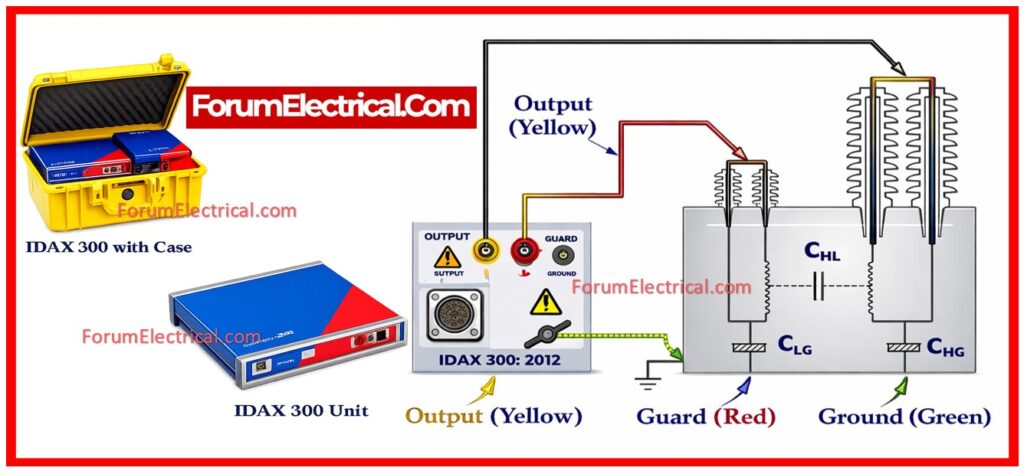
The OMICRON DIRANA is one of the most widely used instruments for the Dielectric Response Analysis.
Features of DIRANA
• Combines Frequency Domain Spectroscopy (FDS),
• Combines Polarization Depolarization Current (PDC),
• Automatic moisture calculation,
• Automatic temperature correction,
• Model-based insulation analysis &
• Accurate moisture determination without oil sampling.
Functions of DIRANA
• Measures dielectric response curve,
• Calculates moisture percentage in paper insulation,
• Evaluates oil conductivity,
• Determines insulation aging condition &
• Transformer Insulation Structure Relevant to DFR.
The major cellulose insulation is located between
• High Voltage (HV) winding and Low Voltage (LV) winding.
• Windings and transformer tank
• Inter-turn insulation
DFR test primarily measures the insulation between HV and LV windings.
Applicable Standards
• IEC 60076-3 – Insulation Levels and Dielectric Tests
• IEC 60076-18 – Measurement of Frequency Response
• NEMA TR 1 – Transformers, Regulators, and Reactors
• NEMA TR 2 – Standard Test Procedure for Transformers
• NEC Article 250 – Grounding and Bonding
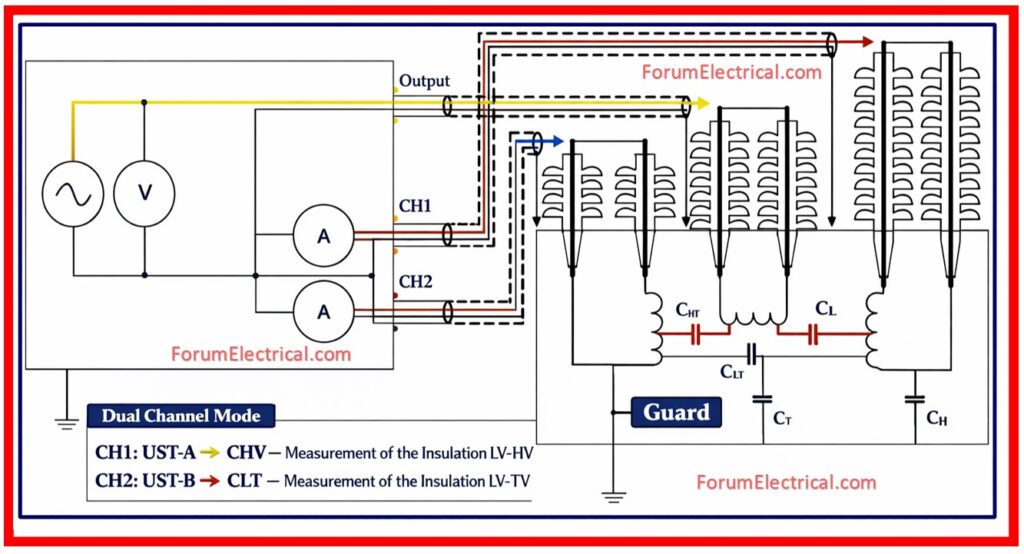
Test Connections
Correct connection is more important for accurate measurement.
Basic Connection Method
• Output terminal → High Voltage winding (HV)
• Input terminal → Low Voltage winding (LV)
• Guard terminal → Transformer tank (ground)
Purpose of Guard Connection
Guard connection eliminates unwanted currents such as:
• Surface leakage currents,
• Tank currents &
• External interference currents.
This ensures an accurate insulation measurement.
Step-by-Step Test Procedure
Step-1: Transformer Preparation
Ensure that transformer is get isolated.
Disconnect from the power supply.
Ensure that transformer is properly grounded.
Clean the bushings and all the connecting terminals.
Step-2: Connect Measurement Equipment
Connections include:
• HV output → HV winding
• Measurement input → LV winding
• Guard → Transformer tank
Ensure:
Metallic connections are clean and no rust (or) paint at any connection points and also check proper grounding.
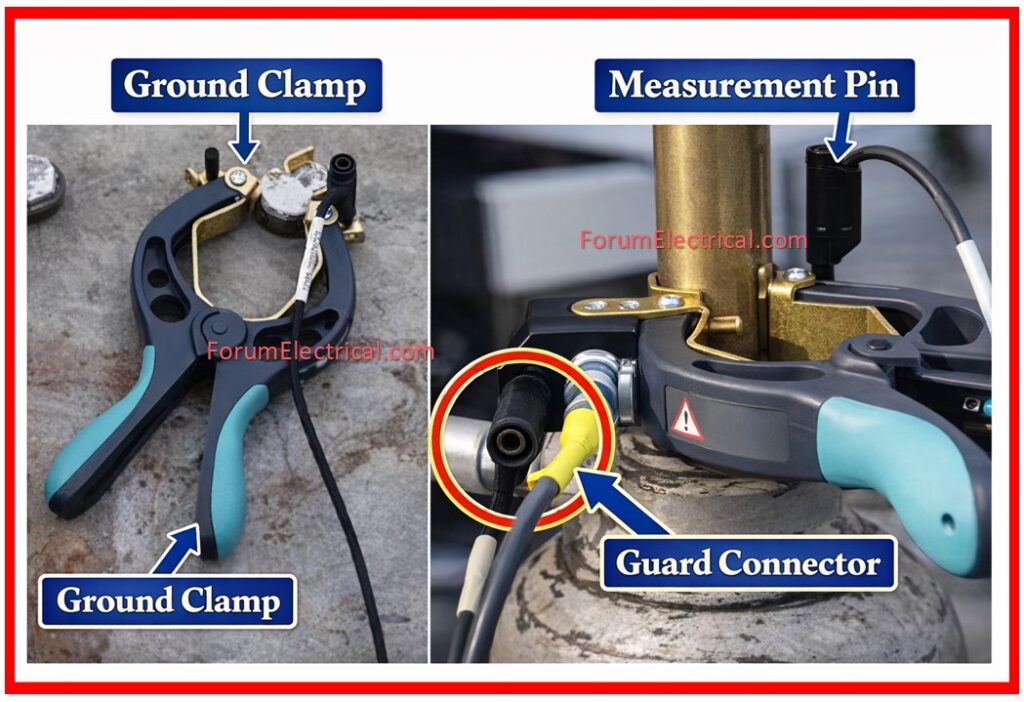
Step-3: Guard Cable Connection
Guard cable should be connected to:
• Transformer tank and
• Ground point
This is used to prevent unwanted capacitive and resistive currents.
Step-4: Perform Frequency Sweep
The analyzer applies test voltage over a wide frequency range and measures:
• Capacitance,
• Power factor and
• Dissipation factor.
Test voltage is typically low and non-destructive.
Step-5: Record Dielectric Response Curve
The instrument plots:
Power Factor vs Frequency curve
This curve provides the information about insulation condition.
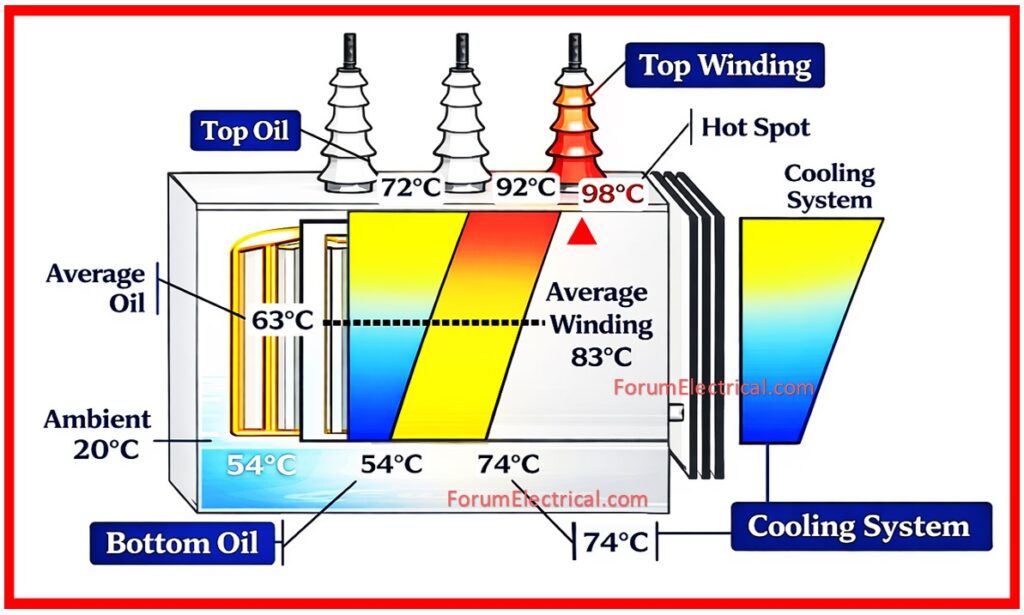
Step-6: Temperature Measurement
Transformer insulation temperature should be recorded because the dielectric response depends on the temperature.
Temperature correction is applied automatically by DIRANA.
Test Overview
DFR combines 2 test methods:
1). Frequency Domain Spectroscopy (FDS)
FDS measures insulation response over frequency range.
FDS provides accurate moisture measurement.
2). Polarization Depolarization Current (PDC)
PDC measures polarization and depolarization currents.
PDC provides information about the insulation aging and moisture.
Interpretation of Dielectric Response Curve
The dielectric response curve contains valuable information about transformer insulation.
Low Frequency Region
Low frequency region provides information about:
• Moisture in cellulose insulation.
• Aging condition.
• Higher response at low frequency indicates higher moisture.
Mid Frequency Region
Mid frequency region provides information about:
• Oil conductivity.
• Oil contamination.
• Shift in slope indicates oil degradation.
High Frequency Region
High frequency region provides information about:
• Oil insulation condition.
• Geometric capacitance.
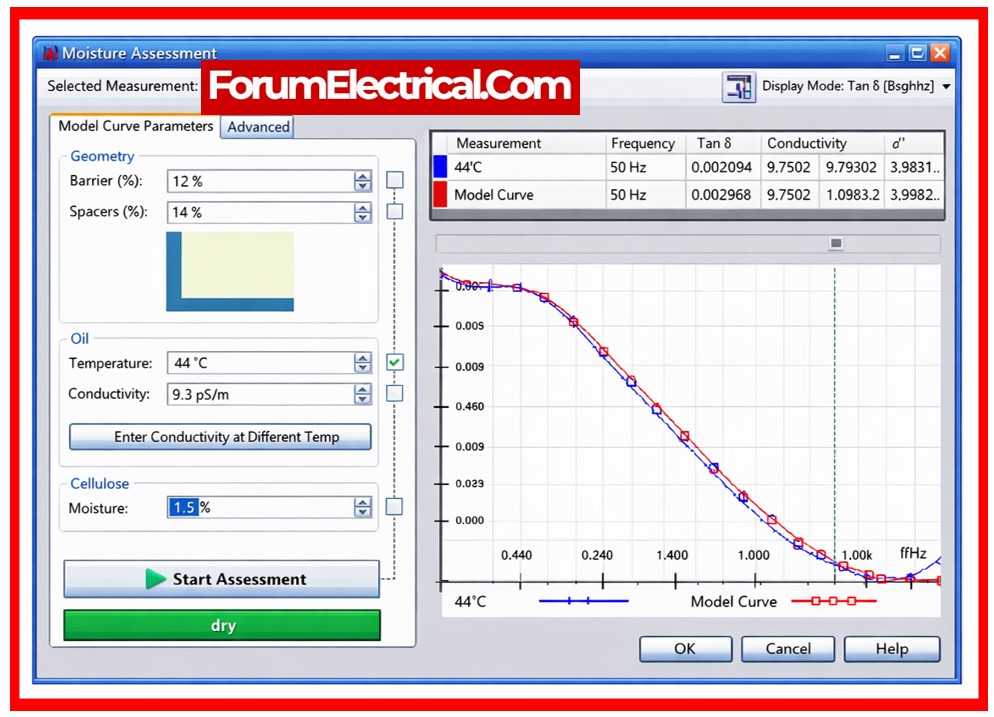
Moisture Calculation
The instrument compares the measured curve with internal model curves.
Based on comparison it calculates:
• Moisture percentage in paper insulation (%),
• Oil conductivity &
• Insulation aging condition.
Typical moisture levels:
| Moisture % | Condition |
|---|---|
| < 1% | Excellent |
| 1 – 2% | Good |
| 2 – 3% | Moderate |
| > 3% | Poor |
| > 4% | Critical |
Reporting
The test report includes:
General Information
• Transformer rating
• Voltage level
• Serial number
• Location
Test Data
• Frequency response curve
• Moisture percentage
• Oil conductivity
• Capacitance values
• Power factor values
Temperature Data
• Oil temperature
• Ambient temperature
Template
Summary
Dielectric Frequency Response Analysis (DFR) is one of the most advanced and reliable methods for assessing transformer insulation condition.
It provides accurate moisture measurement in cellulose insulation, evaluates oil conductivity and helps to determine the insulation aging condition.