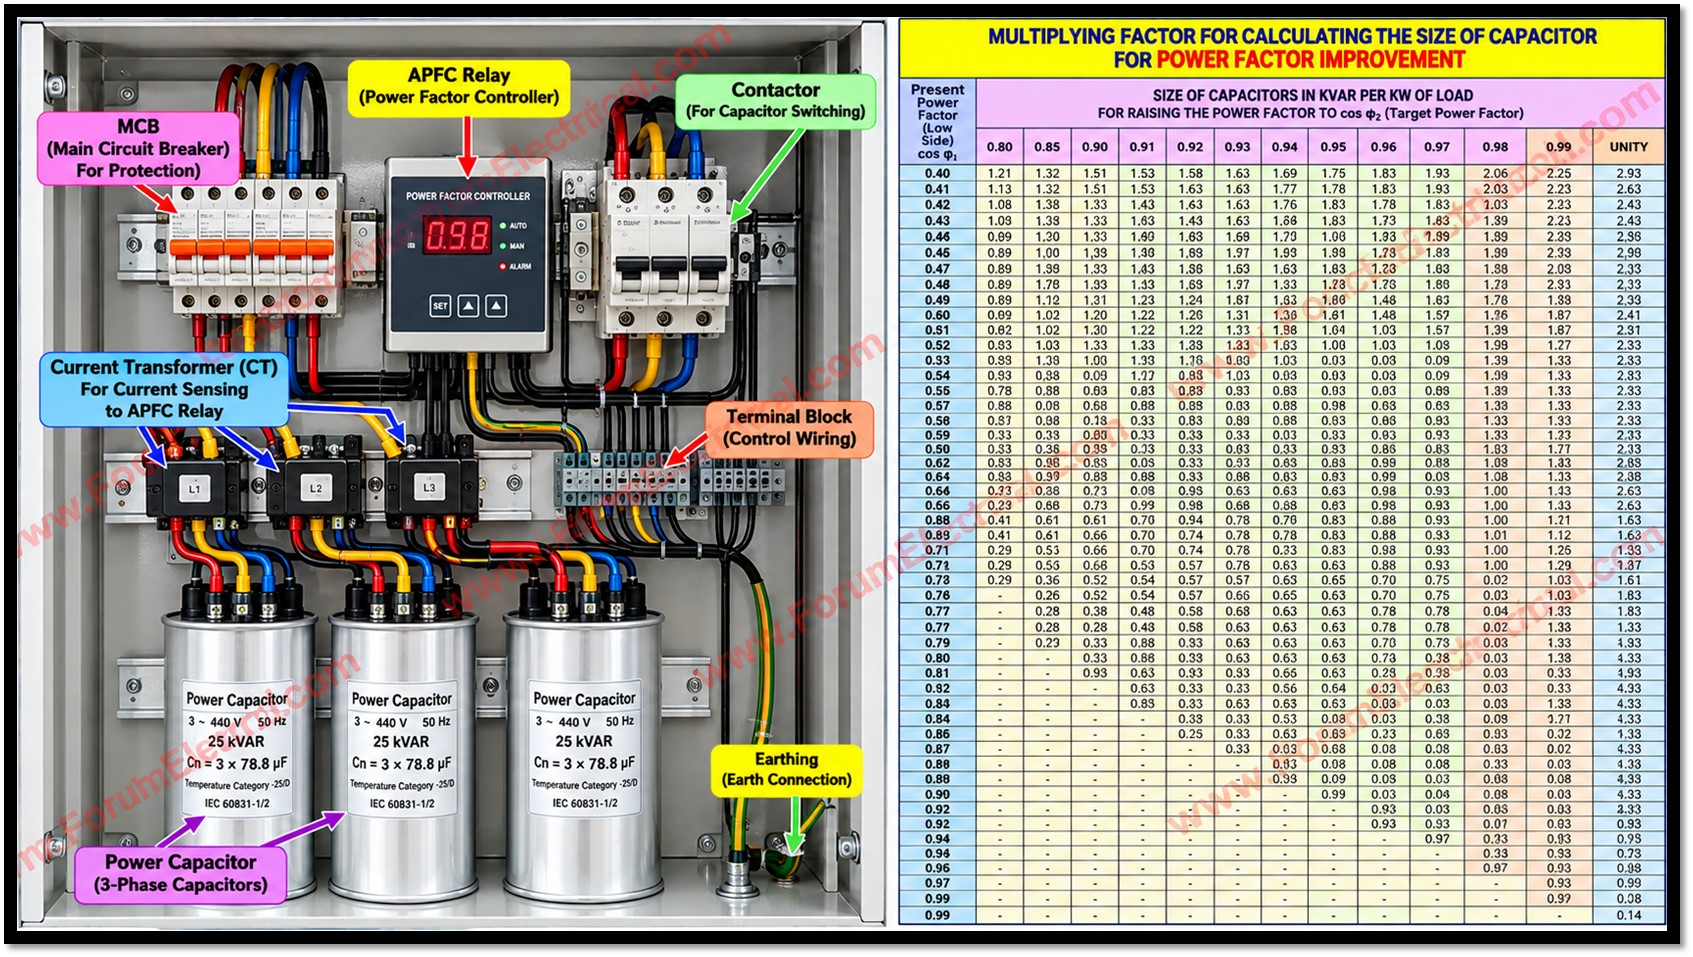
A capacitor chart is a practical engineering reference utilized to estimate the reactive-power compensation needed to improve the power factor of an electrical load.
The chart shown below gives a multiplying factor in kVAR per kW of load for raising the power factor from an existing value to a desired value.
Once the real power of the load in kW and the present and target power-factor values are known, the corresponding factor can be selected from the chart and multiplied by the load in kW to obtain the approximate capacitor-bank size in kVAR.
This method is widely used during
- Preliminary capacitor selection,
- Panel design,
- Power-factor studies and
- Electrical maintenance planning.
Capacitor Chart Basics
The chart is arranged with the existing power factor in the first column and the required (or) target power factor across the top.
The individual cells provide the multiplying factor expressed as capacitor kVAR required per kW of load.
In practical terms, a value of 0.50 means that approximately 0.50 kVAR of capacitive reactive power is required for every 1 kW of real power when correcting between the selected power factor values.
Therefore for a 100 kW load, a factor of 0.50 corresponds to approximately 50kVAR of capacitor compensation.
Basic Formula
The capacitor requirement may be calculated using the following formula:
Required Capacitor kVAR = Load kW x Multiplying Factor
The multiplying factor can also be calculated directly from the power factor values when a chart is not available.
The standard formula is:
Qc = P X [tan(cos⁻¹ PF₁) − tan(cos⁻¹ PF₂)]
where
Qc – Required capacitor rating in kVAR,
P – Active power in Kw
PF₁ – Existing power factor
PF₂ – Desired power factor.
This equation and the chart are 2 ways of expressing the same power factor correction principle.
How to Read the Chart?
Determine the load in kW
Use the actual or calculated active power of the equipment, motor group, plant (or) electrical system being corrected.
Identify the Existing Power Factor
Select the row corresponding to the present power factor (PF).
If the exact value is not available use an appropriate interpolation (or) perform the calculation using the formula.
Select the target Power Factor
Move across the chart table to the column representing the desired corrected power factor (PF).
Read the Multiplying Factor
The intersection of the existing-PF row & target PF column gives the approximate kVAR per kW factor.
Calculate Capacitor Size
Multiply the load in kW by the selected factor.
The result is the required (approx.) approximate capacitor compensation in kVAR.
Capacitor Chart
Capacitor kVAR per kW of Load for Power-Factor Improvement
Required Capacitor kVAR = Load kW x Multiplying Factor
| Existing PF | 0.80 | 0.85 | 0.90 | 0.91 | 0.92 | 0.93 | 0.94 | 0.95 | 0.96 | 0.97 | 0.98 | 0.99 | Unity |
| 0.45 | 1.235 | 1.365 | 1.500 | 1.529 | 1.559 | 1.589 | 1.622 | 1.656 | 1.693 | 1.734 | 1.781 | 1.842 | 1.985 |
| 0.46 | 1.180 | 1.311 | 1.446 | 1.475 | 1.504 | 1.535 | 1.567 | 1.602 | 1.639 | 1.680 | 1.727 | 1.788 | 1.930 |
| 0.47 | 1.128 | 1.258 | 1.394 | 1.422 | 1.452 | 1.483 | 1.515 | 1.549 | 1.586 | 1.627 | 1.675 | 1.736 | 1.878 |
| 0.48 | 1.078 | 1.208 | 1.343 | 1.372 | 1.402 | 1.432 | 1.465 | 1.499 | 1.536 | 1.577 | 1.625 | 1.685 | 1.828 |
| 0.49 | 1.029 | 1.159 | 1.295 | 1.323 | 1.353 | 1.384 | 1.416 | 1.450 | 1.487 | 1.528 | 1.576 | 1.637 | 1.779 |
| 0.50 | 0.982 | 1.112 | 1.248 | 1.276 | 1.306 | 1.337 | 1.369 | 1.403 | 1.440 | 1.481 | 1.529 | 1.590 | 1.732 |
| 0.51 | 0.937 | 1.067 | 1.202 | 1.231 | 1.261 | 1.291 | 1.324 | 1.358 | 1.395 | 1.436 | 1.484 | 1.544 | 1.687 |
| 0.52 | 0.893 | 1.023 | 1.158 | 1.187 | 1.217 | 1.247 | 1.280 | 1.314 | 1.351 | 1.392 | 1.440 | 1.500 | 1.643 |
| 0.53 | 0.850 | 0.980 | 1.116 | 1.144 | 1.174 | 1.205 | 1.237 | 1.271 | 1.308 | 1.349 | 1.397 | 1.458 | 1.600 |
| 0.54 | 0.809 | 0.939 | 1.074 | 1.103 | 1.133 | 1.163 | 1.196 | 1.230 | 1.267 | 1.308 | 1.356 | 1.416 | 1.559 |
| 0.55 | 0.768 | 0.899 | 1.034 | 1.063 | 1.092 | 1.123 | 1.156 | 1.190 | 1.227 | 1.268 | 1.315 | 1.376 | 1.518 |
| 0.56 | 0.729 | 0.860 | 0.995 | 1.024 | 1.053 | 1.084 | 1.116 | 1.151 | 1.188 | 1.229 | 1.276 | 1.337 | 1.479 |
| 0.57 | 0.691 | 0.822 | 0.957 | 0.986 | 1.015 | 1.046 | 1.079 | 1.113 | 1.150 | 1.191 | 1.238 | 1.299 | 1.441 |
| 0.58 | 0.655 | 0.785 | 0.920 | 0.949 | 0.979 | 1.009 | 1.042 | 1.076 | 1.113 | 1.154 | 1.201 | 1.262 | 1.405 |
| 0.59 | 0.618 | 0.749 | 0.884 | 0.913 | 0.942 | 0.973 | 1.006 | 1.040 | 1.077 | 1.118 | 1.165 | 1.226 | 1.368 |
| 0.60 | 0.583 | 0.714 | 0.849 | 0.878 | 0.907 | 0.938 | 0.970 | 1.005 | 1.042 | 1.083 | 1.130 | 1.191 | 1.333 |
| 0.61 | 0.549 | 0.679 | 0.815 | 0.843 | 0.873 | 0.904 | 0.936 | 0.970 | 1.007 | 1.048 | 1.096 | 1.157 | 1.299 |
| 0.62 | 0.515 | 0.646 | 0.781 | 0.810 | 0.839 | 0.870 | 0.903 | 0.937 | 0.974 | 1.015 | 1.062 | 1.123 | 1.265 |
| 0.63 | 0.483 | 0.613 | 0.748 | 0.777 | 0.807 | 0.837 | 0.870 | 0.904 | 0.941 | 0.982 | 1.030 | 1.090 | 1.233 |
| 0.64 | 0.451 | 0.581 | 0.716 | 0.745 | 0.775 | 0.805 | 0.838 | 0.872 | 0.909 | 0.950 | 0.998 | 1.058 | 1.201 |
| 0.65 | 0.419 | 0.549 | 0.685 | 0.714 | 0.743 | 0.774 | 0.806 | 0.840 | 0.877 | 0.919 | 0.966 | 1.027 | 1.169 |
| 0.66 | 0.388 | 0.519 | 0.654 | 0.683 | 0.712 | 0.743 | 0.775 | 0.810 | 0.847 | 0.888 | 0.935 | 0.996 | 1.138 |
| 0.67 | 0.358 | 0.488 | 0.624 | 0.652 | 0.682 | 0.713 | 0.745 | 0.779 | 0.816 | 0.857 | 0.905 | 0.966 | 1.108 |
| 0.68 | 0.328 | 0.459 | 0.594 | 0.623 | 0.652 | 0.683 | 0.715 | 0.750 | 0.787 | 0.828 | 0.875 | 0.936 | 1.078 |
| 0.69 | 0.299 | 0.429 | 0.565 | 0.593 | 0.623 | 0.654 | 0.686 | 0.720 | 0.757 | 0.798 | 0.846 | 0.907 | 1.049 |
| 0.70 | 0.270 | 0.400 | 0.536 | 0.565 | 0.594 | 0.625 | 0.657 | 0.692 | 0.729 | 0.770 | 0.817 | 0.878 | 1.020 |
| 0.71 | 0.242 | 0.372 | 0.508 | 0.536 | 0.566 | 0.597 | 0.629 | 0.663 | 0.700 | 0.741 | 0.789 | 0.849 | 0.992 |
| 0.72 | 0.214 | 0.344 | 0.480 | 0.508 | 0.538 | 0.569 | 0.601 | 0.635 | 0.672 | 0.713 | 0.761 | 0.821 | 0.964 |
| 0.73 | 0.186 | 0.316 | 0.452 | 0.481 | 0.510 | 0.541 | 0.573 | 0.608 | 0.645 | 0.686 | 0.733 | 0.794 | 0.936 |
| 0.74 | 0.159 | 0.289 | 0.425 | 0.453 | 0.483 | 0.514 | 0.546 | 0.580 | 0.617 | 0.658 | 0.706 | 0.766 | 0.909 |
| 0.75 | 0.132 | 0.262 | 0.398 | 0.426 | 0.456 | 0.487 | 0.519 | 0.553 | 0.590 | 0.631 | 0.679 | 0.739 | 0.882 |
| 0.76 | 0.105 | 0.235 | 0.371 | 0.400 | 0.429 | 0.460 | 0.492 | 0.526 | 0.563 | 0.605 | 0.652 | 0.713 | 0.855 |
| 0.77 | 0.079 | 0.209 | 0.344 | 0.373 | 0.403 | 0.433 | 0.466 | 0.500 | 0.537 | 0.578 | 0.626 | 0.686 | 0.829 |
| 0.78 | 0.052 | 0.183 | 0.318 | 0.347 | 0.376 | 0.407 | 0.439 | 0.474 | 0.511 | 0.552 | 0.599 | 0.660 | 0.802 |
| 0.79 | 0.026 | 0.156 | 0.292 | 0.320 | 0.350 | 0.381 | 0.413 | 0.447 | 0.484 | 0.525 | 0.573 | 0.634 | 0.776 |
| 0.80 | 0.000 | 0.130 | 0.266 | 0.294 | 0.324 | 0.355 | 0.387 | 0.421 | 0.458 | 0.499 | 0.547 | 0.608 | 0.750 |
| 0.81 | – | 0.104 | 0.240 | 0.268 | 0.298 | 0.329 | 0.361 | 0.395 | 0.432 | 0.473 | 0.521 | 0.581 | 0.724 |
| 0.82 | – | 0.078 | 0.214 | 0.242 | 0.272 | 0.303 | 0.335 | 0.369 | 0.406 | 0.447 | 0.495 | 0.556 | 0.698 |
| 0.83 | – | 0.052 | 0.188 | 0.216 | 0.246 | 0.277 | 0.309 | 0.343 | 0.380 | 0.421 | 0.469 | 0.530 | 0.672 |
| 0.84 | – | 0.026 | 0.162 | 0.190 | 0.220 | 0.251 | 0.283 | 0.317 | 0.354 | 0.395 | 0.443 | 0.503 | 0.646 |
| 0.85 | – | 0.000 | 0.135 | 0.164 | 0.194 | 0.225 | 0.257 | 0.291 | 0.328 | 0.369 | 0.417 | 0.477 | 0.620 |
| 0.86 | – | – | 0.109 | 0.138 | 0.167 | 0.198 | 0.230 | 0.265 | 0.302 | 0.343 | 0.390 | 0.451 | 0.593 |
| 0.87 | – | – | 0.082 | 0.111 | 0.141 | 0.172 | 0.204 | 0.238 | 0.275 | 0.316 | 0.364 | 0.424 | 0.567 |
| 0.88 | – | – | 0.055 | 0.084 | 0.114 | 0.145 | 0.177 | 0.211 | 0.248 | 0.289 | 0.337 | 0.397 | 0.540 |
| 0.89 | – | – | 0.028 | 0.057 | 0.086 | 0.117 | 0.149 | 0.184 | 0.221 | 0.262 | 0.309 | 0.370 | 0.512 |
| 0.90 | – | – | 0.000 | 0.029 | 0.058 | 0.089 | 0.121 | 0.156 | 0.193 | 0.234 | 0.281 | 0.342 | 0.484 |
| 0.91 | – | – | – | 0.000 | 0.030 | 0.060 | 0.093 | 0.127 | 0.164 | 0.205 | 0.253 | 0.313 | 0.456 |
| 0.92 | – | – | – | – | 0.000 | 0.031 | 0.063 | 0.097 | 0.134 | 0.175 | 0.223 | 0.284 | 0.426 |
| 0.93 | – | – | – | – | – | 0.000 | 0.032 | 0.067 | 0.104 | 0.145 | 0.192 | 0.253 | 0.395 |
| 0.94 | – | – | – | – | – | – | 0.000 | 0.034 | 0.071 | 0.112 | 0.160 | 0.220 | 0.363 |
| 0.95 | – | – | – | – | – | – | – | 0.000 | 0.037 | 0.078 | 0.126 | 0.186 | 0.329 |
| 0.96 | – | – | – | – | – | – | – | – | 0.000 | 0.041 | 0.089 | 0.149 | 0.292 |
| 0.97 | – | – | – | – | – | – | – | – | – | 0.000 | 0.048 | 0.108 | 0.251 |
| 0.98 | – | – | – | – | – | – | – | – | – | – | 0.000 | 0.061 | 0.203 |
| 0.99 | – | – | – | – | – | – | – | – | – | – | – | 0.000 | 0.142 |
How to use the chart?
Select the existing power factor from the first column and the desired power factor from the top row.
The intersection gives the capacitor requirement in kVAR per kW.
Multiply that value by the load in kW.
Example:
For 100 kW at 0.77 PF corrected to 0.95 PF, the factor is approximately 0.500.
Therefore capacitor requirement ≈ 100 X 0.500 = 50 kVAR.
Note:
Values are calculated from the equation
Qc = P X [tan(cos⁻¹ PF₁) − tan(cos⁻¹ PF₂)]
& rounded to three decimals.
Solved Example
Consider a 100kW electrical load operating at an existing power factor (PF) of 0.77.
The objective is to improve the power factor to 0.95.
From the chart, the multiplying factor for 0.77 to 0.95 is approximately 0.50.
Therefore:
Capacitor kVAR ≈ 100 kW x 0.50 = 50 kVAR
The chart therefore indicates approximately 50 kVAR of capacitive compensation.
The same result can be checked using the standard equation.
For PF₁ = 0.77 and PF₂ = 0.95, the calculated factor is approximately 0.500, which confirms the chart value.
In an actual installation, the final bank rating must also consider the load profile, available standard capacitor ratings, switching steps, harmonic conditions and the operating voltage.
Why Power Factor Correction is Required?
Inductive loads such as
- Induction motors,
- Transformers,
- Welding equipment and
- Discharge (or) Magnetic devices
require reactive power for their magnetic fields.
When the power factor is low, more current is required to deliver the same real power.
This can increase losses in cables and transformers and can reduce the available capacity of electrical equipment.
A suitably designed capacitor bank supplies part of the required reactive power locally reducing the reactive component of current and improving the overall power factor.
Typical Applications
- Capacitor charts are commonly used for industrial plants, manufacturing facilities, commercial buildings, pump stations, motor-control centres, transformer-fed distribution systems and automatic power-factor-correction (APFC) panels.
- They are especially useful when a quick estimate is needed before a detailed load flow (or) power quality study.
- The chart can also assist maintenance engineers in checking whether an installed capacitor bank is broadly appropriate for the measured load and power factor.
Capacitor Selection Factors
The chart is a sizing reference; it must not be considered the entire capacitor bank design technique.
Before installation, check the system voltage, frequency, load fluctuation, capacitor voltage rating, switching mechanism, enclosure requirements, protection, discharge resistors & installation environment.
For changeable loads, an automatically switched APFC bank can be preferable to a fixed capacitor because it may connect or disconnect capacitor stages based on reactive-power requirements.
Harmonics need special attention. Capacitors may interact with system inductance that is causing resonance conditions in networks with variable frequency drives (VFD), UPS systems, rectifiers, arc equipment and other non-linear loads.
When severe harmonic distortion exists, a harmonic analysis must be conducted, and detuned reactors or other appropriate mitigating measures may be necessary.
Throughout selection, installation, testing, and commissioning, follow the instructions provided by the capacitor manufacturer as well as any applicable electrical standards.
Common Errors
- Using kVA instead of kW as the load value in the multiplying-factor method.
- Selecting the target power factor without checking whether overcorrection could occur during low load operation.
- Ignoring the actual operating voltage and frequency of the capacitor bank.
- Installing capacitors on a system with significant harmonics without evaluating resonance and capacitor stress.
- Assuming that a single fixed capacitor is suitable for a load whose reactive demand changes substantially.
- Selecting a final commercial capacitorbank rating without checking standard step sizes, switching duty, protection, and manufacturer data.
Quick Reference Table
| Parameter | Symbol | Description |
| Active power | P | Real electrical power consumed by the load, expressed in kW. |
| Existing power factor | PF₁ | Power factor before correction. |
| Target power factor | PF₂ | Desired power factor after correction. |
| Capacitor reactive power | Qc | Required capacitive compensation, expressed in kVAR. |
| Multiplying factor | MF | Required capacitor kVAR per kW of load. |
Conclusion
Capacitor charts are simple and effective for estimating reactive-power compensation for power-factor improvement.
An engineer can easily estimate capacitor kVAR requirements by determining the power factor, selecting the appropriate power factor, reading the multiplication factor and multiplying by the load in kW.
This chart shows that 50 kVAR is needed to rectify a 100 kW load from 0.77 to 0.95. For final project selection, the computed value should be verified against operating conditions, load variation, harmonics, voltage rating, switching needs, protection and manufacturer recommendations.
Effectively applying these checklist and chart ensures power factor correction without overcompensation, capacitor stress (or) resonance issues.

