
Solar PV Module
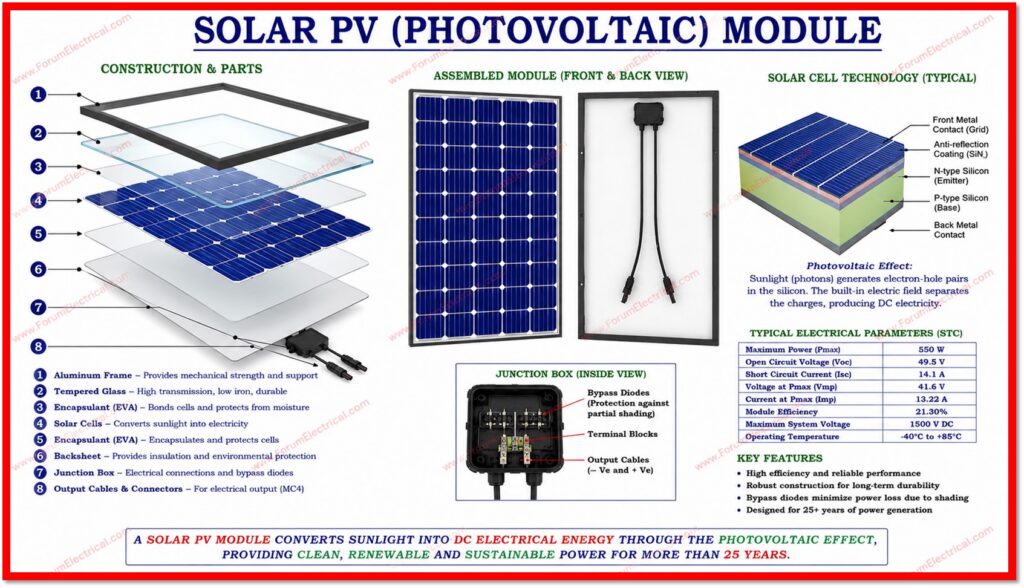
A Solar PV (Photovoltaic) Module is the most fundamental important component of any solar power plant.
It is responsible for converting sunlight directly into electrical energy via the photovoltaic effect (PV effect) a process by which the semiconducting materials generate an electric current when exposed to photons of light.
Understanding the construction, operating parameters, cell technologies, loss mechanisms, common defects and testing methodologies of a solar module is essential for every solar engineer and project professional.
A well-selected, installed & maintained solar module can generate power for over 25 years generating long-term returns and contributing to clean energy generation targets.
Module Construction
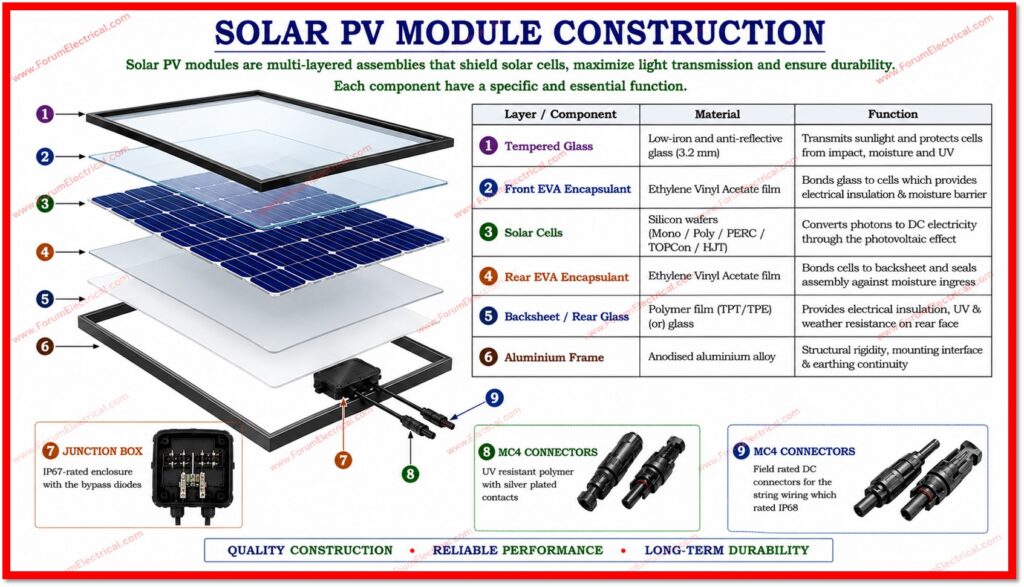
Solar PV modules are multi-layered assemblies that shield solar cells, maximize light transmission and ensure durability.
Each component have a specific and essential function.
| Layer / Component | Material | Function |
|---|---|---|
| Tempered Glass | Low-iron and anti-reflective glass (3.2 mm) | Transmits sunlight and protects cells from impact, moisture and UV |
| Front EVA Encapsulant | Ethylene Vinyl Acetate film | Bonds glass to cells which provides electrical insulation & moisture barrier |
| Solar Cells | Silicon wafers (Mono / Poly / PERC / TOPCon / HJT) | Converts photons to DC electricity through the photovoltaic effect |
| Rear EVA Encapsulant | Ethylene Vinyl Acetate film | Bonds cells to backsheet and seals assembly against moisture ingress |
| Backsheet / Rear Glass | Polymer film (TPT/TPE) (or) glass | Provides electrical insulation, UV & weather resistance on rear face |
| Aluminium Frame | Anodised aluminium alloy | Structural rigidity, mounting interface & earthing continuity |
| Junction Box | IP67-rated enclosure with the bypass diodes | Houses electrical connections and bypass diodes protect shaded cells |
| MC4 Connectors | UV resistant polymer with silver plated contacts | Field rated DC connectors for the string wiring which rated IP68 |
Electrical Parameters
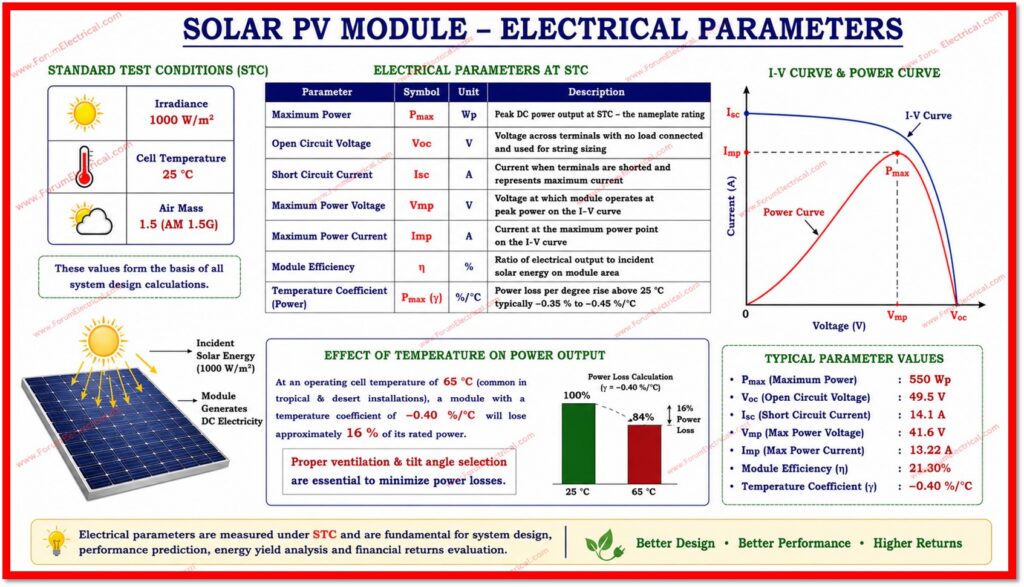
Module electrical parameters are measured & specified under Standard Test Conditions (STC):
- Irradiance of 1000 W/m²,
- Cell temperature of 25 °C and
- Air Mass 1.5 (AM 1.5G) spectrum.
These values form the basis of all the system design calculations.
| Parameter | Symbol | Unit | Description |
|---|---|---|---|
| Maximum Power | Pmax | Wp | Peak DC power output at STC – the nameplate rating |
| Open Circuit Voltage | Voc | V | Voltage across terminals with no load connected and used for string sizing |
| Short Circuit Current | Isc | A | Current when terminals are shorted and represents maximum current |
| Maximum Power Voltage | Vmp | V | Voltage at which module operates at peak power on the I-V curve |
| Maximum Power Current | Imp | A | Current at the maximum power point on the I-V curve |
| Module Efficiency | η | % | Ratio of electrical output to incident solar energy on module area |
| Temperature Coefficient | Pmax (γ) | %/°C | Power loss per degree rise above 25 °C and typically −0.35 % to −0.45 %/°C |
Temperature coefficients are essential for hot climates.
At an operating cell temperature of 65 °C (common in tropical & desert installations), a module with a coefficient of −0.40 %/°C will lose approximately 16 % of its rated power, highlighting the importance of proper ventilation & tilt angle selection.
Solar Cell Technologies
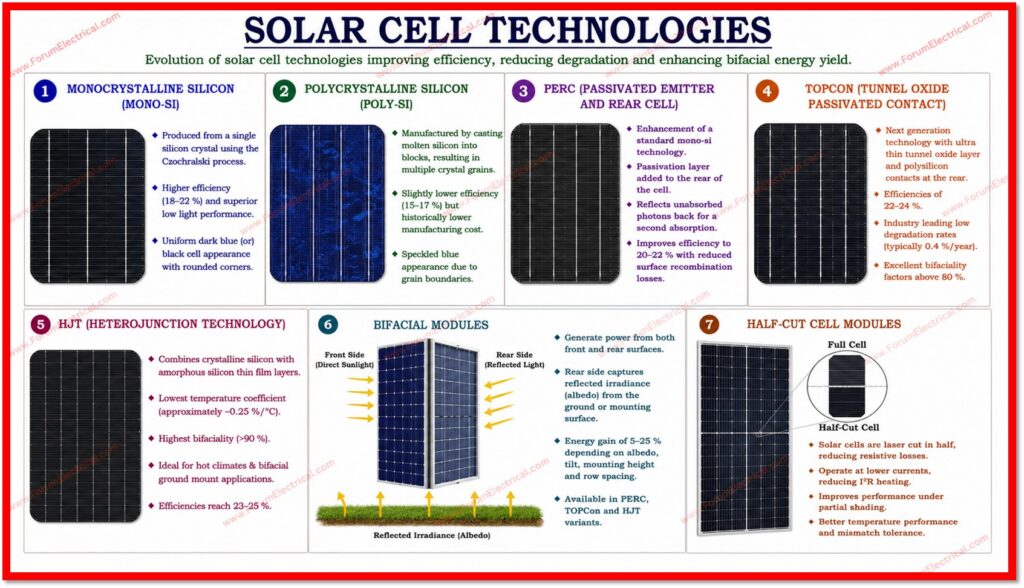
The solar industry has evolved significantly from the basic polycrystalline modules to advanced heterojunction and bifacial technologies.
Each provides distinct advantages in efficiency, degradation rate, temperature performance and cost.
Monocrystalline Silicon (Mono-Si)
Monocrystalline Silicon (Mono-Si) produced from a single silicon crystal using the Czochralski process.
Monocrystalline Silicon (Mono-Si) produce higher efficiency (18–22 %) and superior low light performance compared to polycrystalline modules.
Monocrystalline Silicon (Mono-Si) is identified by uniform dark blue (or) black cell appearance with rounded corners.
Polycrystalline Silicon (Poly-Si)
Polycrystalline Silicon (Poly-Si)is manufactured by casting molten silicon into blocks, resulting in multiple crystal grains.
Polycrystalline Silicon (Poly-Si) is slightly lower efficiency (15–17 %) but historically lower manufacturing cost.
Polycrystalline Silicon (Poly-Si) is characterised by a speckled blue appearance due to grain boundaries.
PERC (Passivated Emitter and Rear Cell)
An enhancement of a standard monocrystalline technology where a passivation layer is added to the rear of the cell.
This reflects unabsorbed photons back via the cell for a second absorption opportunity improving efficiency to 20–22 % with reduced surface recombination losses.
TOPCon (Tunnel Oxide Passivated Contact)
TOPCon is a next generation technology featuring an ultra thin tunnel oxide layer with polysilicon contacts at the rear.
TOPCon modules achieve efficiencies of 22–24 % with industry leading low degradation rates (typically 0.4 %/year) & excellent bifaciality factors above 80 %.
HJT (Heterojunction Technology)
HJT combines crystalline silicon with amorphous silicon thin film layers.
HJT modules exhibit the lowest temperature coefficient (approximately −0.25 %/°C) & highest bifaciality (>90 %) making them ideal for hot climates & bifacial ground mount applications.
Efficiencies reach 23–25 %.
Bifacial Modules
Bifacial modules generate power from both the front and rear surfaces.
The rear side captures the reflected irradiance (albedo) from the ground (or) mounting surface providing an energy gain of 5–25 % depending on albedo, tilt, mounting height and row spacing.
It is available in PERC, TOPCon and HJT variants.
Half-Cut Cell Modules
Solar cells are laser cut in half, reducing resistive losses & improving performance under partial shading.
Half-cut cells operate at a lower currents, reducing I²R heating, improving temperature performance and providing better mismatch tolerance when one half of the module is shaded.
Common Power Losses
Due to environmental, electrical, and degrading losses module output always falls short of STC rated power.
Understanding & quantifying these losses is essential for accurate energy yield assessment.
- Dust & Soiling Loss: Dust, bird droppings, pollen and industrial particulates accumulate on the module surface that is blocking incoming light. Losses range from 2-8 % in arid regions and can exceed 15 % in heavily polluted industrial zones without any regular cleaning.
- Shading Loss: Partial shading from trees, chimneys, cable trays (or) adjacent rows causes disproportionately large power losses due to the series nature of cell strings. Bypass diodes limits the damage but energy losses can reach 5-20 %.
- Temperature Loss: Module (PV Module) power decreases with temperature increase. High ambient temperatures & poor ventilation in rooftop arrays reduce generation by 10-20 % in summer months in tropical climates.
- Mismatch Loss: Variations in Isc between modules connected in series force all modules to operate at the weakest module current which is leading to 1-3 % system-level losses. LID (Light-Induced Degradation) compounds this in the first year.
- Cable & Wiring Loss: Resistive losses in DC string cables, AC cables and connectors. Properly designed systems limit this to <1 % and undersized (or) corroded cables can cause 2-4 % losses.
- PID (Potential-Induced Degradation): High voltage stress between the module frame and cells causes the leakage currents that degrade cell performance. PID-resistant module designs and anti-PID inverter settings mitigate this loss.
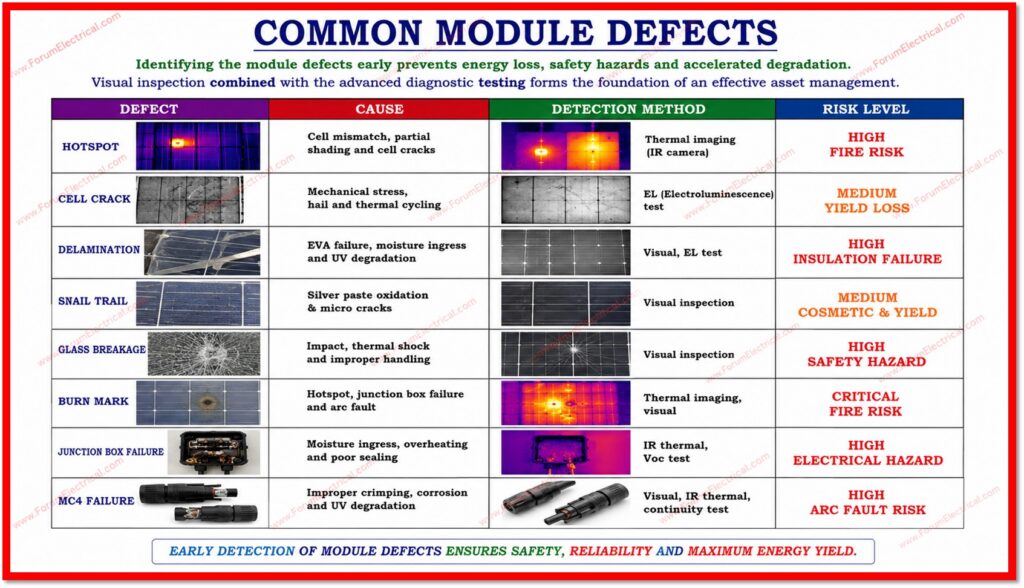
Common Module Defects
Identifying the module defects early prevents energy loss, safety hazards and accelerated degradation.
Visual inspection combined with the advanced diagnostic testing forms the foundation of an effective asset management.
| Defect | Cause | Detection Method | Risk Level |
|---|---|---|---|
| Hotspot | Cell mismatch, partial shading and cell cracks | Thermal imaging (IR camera) | High fire risk |
| Cell Crack | Mechanical stress, hail and thermal cycling | EL (Electroluminescence) test | Medium yield loss |
| Delamination | EVA failure, moisture ingress and UV degradation | Visual, EL test | High insulation failure |
| Snail Trail | Silver paste oxidation & micro cracks | Visual inspection | Medium cosmetic & yield |
| Glass Breakage | Impact, thermal shock and improper handling | Visual inspection | High safety hazard |
| Burn Mark | Hotspot, junction box failure and arc fault | Thermal imaging, visual | Critical fire risk |
| Junction Box Failure | Moisture ingress, overheating and poor sealing | IR thermal, Voc test | High electrical hazard |
| MC4 Failure | Improper crimping, corrosion and UV degradation | Visual, IR thermal, continuity test | High arc fault risk |
Testing
Regular and systematic testing is the primary one of maintaining module performance and plant reliability throughout the asset life.
The following methods are employed during commissioning and O&M phases.
Voc Test
Open circuit voltage of each string is measured and compared against the calculated theoretical Voc.
Significant deviations indicate module failures, reversed polarity connections (or) broken bypass diodes.
Isc Test
Shortcircuit current measured at the known irradiance levels.
Pyranometer values adjust it to STC and deviations indicate shadowing, soiling (or) damaged cells.
Insulation Resistance Test (Megger/IR Test)
DC voltage of 500-1000 V is applied between live conductors & earth.
Readings below 1 MΩ indicate insulation breakdown (or) moisture ingress which is a critical safety check before energisation.
Thermal Imaging (IR Thermography)
Infrared cameras capture heat signatures across the module surface under any operating conditions. Hotspots, junction box failures and bypass diode failures appear as the temperature anomalies.
Electroluminescence (EL) Test
A DC current is injected into the module in darkness causing cells to emit near infrared light proportional to local efficiency.
EL imaging reveals micro cracks, broken fingers, inactive cell areas and delamination with a high resolution.
I-V Curve Tracer Test
The complete current voltage characteristic curve of a module (or) string is measured & compared against the manufacturers rated curve.
Fill Factor (FF) degradation, series resistance increase and shunt resistance reduction are all identifiable from the curve shape deviations.
Site Engineer Commissioning Checklist
Prior to energizing a solar PV plant each of the following checks should be completed and recorded.
This systematic checklist prevents the commissioning failures and ensures long term system reliability.
| S.No | Check Item | Method | Pass Criteria |
|---|---|---|---|
| 1 | Serial Number Verification | Visual scan / barcode reader | Matches delivery challan and BOM |
| 2 | Visual Inspection | Physical examination | No cracks, delamination, or damage |
| 3 | MC4 Connector Tightness | Hand pull test & visual | Fully engaged and no exposed copper |
| 4 | Module Clamp Torque | Torque wrench | As per manufacturer spec (typically 25-30 Nm) |
| 5 | Earthing Continuity | Milliohm meter / continuity tester | < 1 Ω frame to earth bus |
| 6 | String Voc Measurement | Multimeter (DC range) | Within ±3 % of calculated Voc |
| 7 | String Isc Measurement | Clamp meter at STC-corrected irradiance | Within ±5 % of calculated Isc |
| 8 | Insulation Resistance | Megger at 1000 V DC | > 1 MΩ (>100 MΩ preferred) |
| 9 | Cable Routing Inspection | Visual walk-through | No sharp bends, UV-rated conduit and secured |
| 10 | Module Cleaning Status | Visual inspection | Free of dust, debris and bird droppings |
Standards
- IEC 61215 and
- IEC 61730
Conclusion
The Solar PV Module is the heart of every solar power system.
The Solar PV Module is the heart of every solar power system.
A thorough understanding of its construction, electrical parameters, available technologies, loss mechanisms and testing protocols enables solar engineers to make informed decisions throughout the project lifecycle, from bankable energy yield assessments during development to quality control during EPC and monitoring performance during operation and maintenance.

