
What is a Bode Plot?
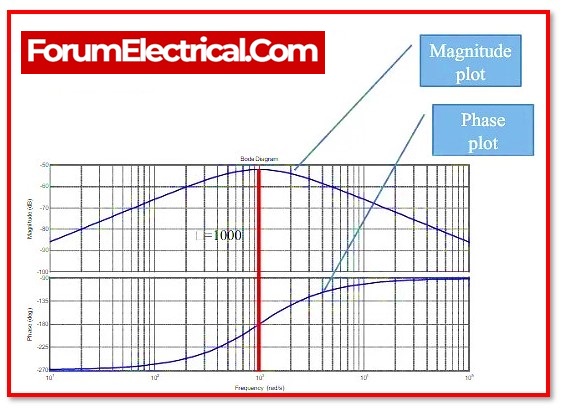
In the field of control system engineering, a graph known as a Bode plot is often used to determine whether a control system is stable. The frequency response of the system is plotted out using a Bode plot, which is comprised of two graphs:
- The Bode magnitude plot, which measures magnitude in decibels.
- The Bode phase plot, which measures the phase shift in degrees.
Hendrik Wade Bode, who was working at Bell Laboratories in the United States, was the one who initially proposed the use of Bode plots in the 1930s. According to the Nyquist stability criteria, Bode plots are incapable of dealing with transfer functions that include right half plane singularities, although having the advantage that they provide an extremely simple method for calculating system stability.
How to construct a Bode Plot?
Keeping all of the above concepts in mind, we may create a Bode plot for the any type of control system. Let go through how to create a Bode plot:
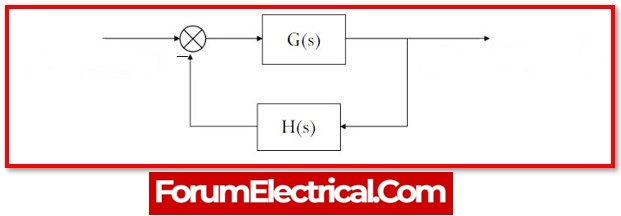
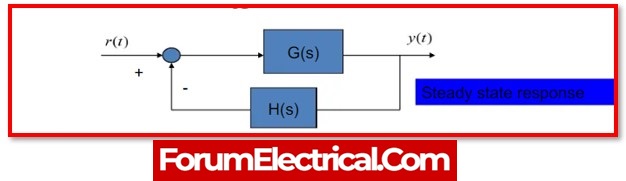
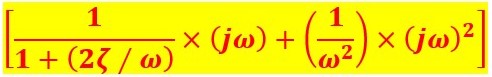
- Insert the s = jω in open loop transfer function G(s) × H(s).
- Find and tabulate the relevant corner frequencies.
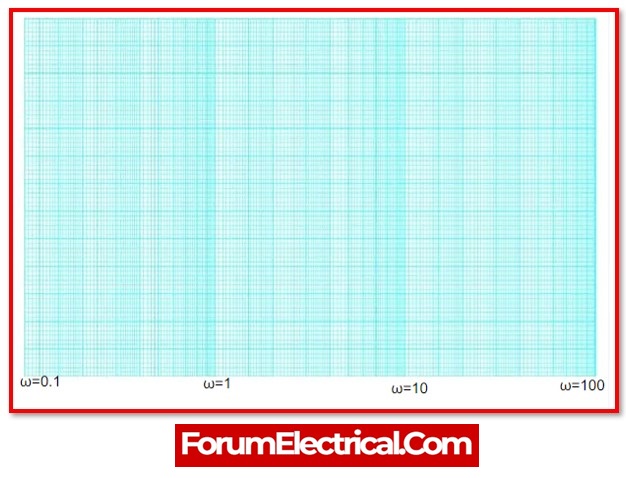
- Therefore it’s necessary to set a frequency range for one semi-log graph such that the plot begins with a frequency lower than the lowest corner frequency.
- Mark the x-axis for angular frequencies, the left side of y-axis for slopes with a zero slope in the middle, and the right side for phase anglewith -180o in the middle.
- Determine the system’s gain factor and order type.
- Calculate the slope for each component accordingly.
To create the Bode magnitude plot, follow these steps:
- On the semi-log graph paper, mark the corner frequency.
- Tabulate these components or factors in the specified order, from top to bottom.
- K is a constant term.
- Integral factor

- First-order factor
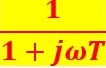
- First-order factor

- Second-order factor
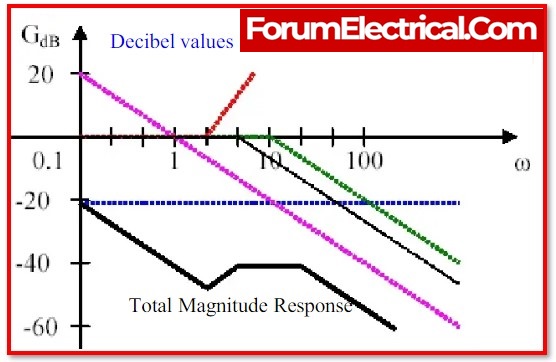
- Draw the line using the matching slope of the factor that was given.
- Get the magnitude plot by adjusting the slope at each corner frequency and then adding the slope of the subsequent factor.
- Determine the gain margin.
Drawing the Bode phase plot requires:
- Add all of the phases of the components or factors to get the phase function.
- Change the values in the function mentioned above to determine the phase at various points, plot a curve, and get a phase curve.
- Execute the phase margin calculation.
Bode Stability Criteria
The following conditions for stability are listed:
1). For the Stable System
The phase margin should be significantly greater than gain margin or both margins should be positive.
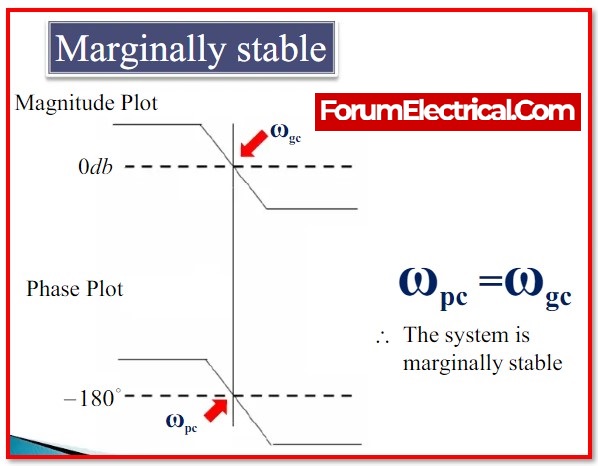
2). For the Marginal Stable System
Either the phase margin and the gain margin should be identical, or both margins should be 0.
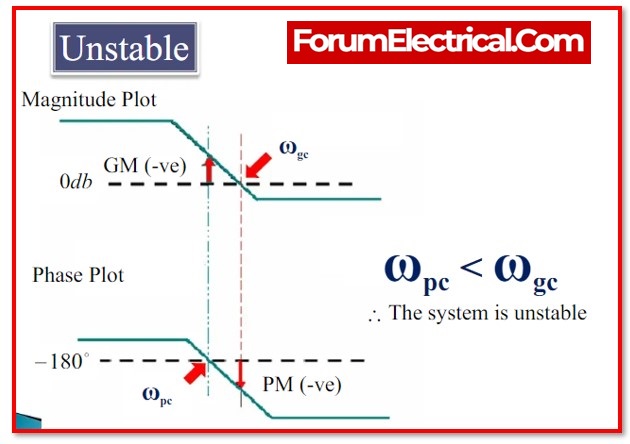
3). For the Unstable System
Phase margin should be lower than gain margin if either of them are negative or both.
Advantages of the Bode Plot
- The asymptotic approximation, that provides a quick way to represent the logarithmic magnitude curve, serves as the basis for the above method.
- Since using a logarithmic scale, can consider the division as a subtraction while treating the multiplication of different magnitudes that occur in the transfer function as an addition.
- Only with the support of this graphic, without the support of any computations, can instantaneously remark on the stability of the system.
- When it comes to gain margin & phase margin, bode plots provide rather stable results.
- Additionally, it spans the whole frequency spectrum, from low to high.
Analysis of Stability Using Bode Plots
Based on the values of these parameters, may determine from the Bode plots either the control system is stable, moderately stable, or unstable.
- Phase Cross over Frequency
- Gain cross over frequency
- Gain margin & phase margin
Phase Cross Over Frequency
Phase cross over frequency is the frequency at which the phase plot exhibits a phase of -1800. pc is used to indicate it. Rad/sec is the symbol for phase cross over frequency.
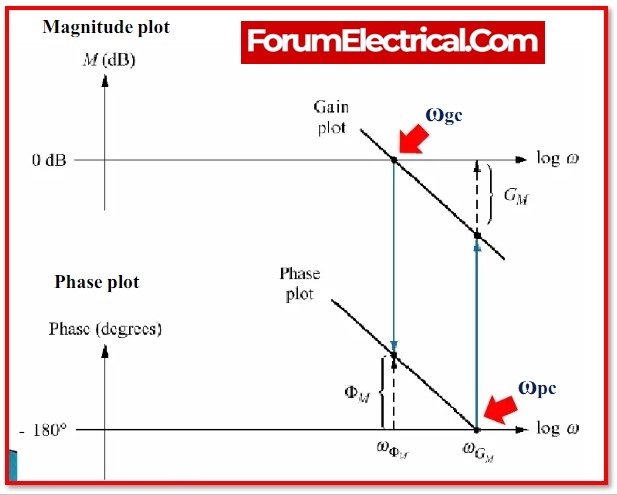
Gain Cross Over Frequency
Gain cross over frequency is the frequency at which the magnitude plot has a magnitude of 0 dB. ωgc is used to indicate it. Gain cross over frequency is measured in rad/sec.
The control system’s stability is based on the phase cross-over frequency & gain cross-over frequency connection with one another.

- The control system is stable if the phase cross over frequency (ωpc) is larger than the gain cross over frequency (ωgc).
- The control system is marginally stable if the phase cross over frequency (ωpc) and gain cross over frequency (ωgc) are identical.
- The control system is unstable if the phase cross over frequency (ωpc) is lower than the gain cross over frequency (ωgc).
Gain Margin
The stability of the system increases with the Gain Margin (GM) value. The amount of gain that may be increased (or) decreased without causing the system to become unstable is referred to as the gain margin. Magnitude is usually expressed as dB.
Usually, the Bode plot allows to interpret the gain margin immediately. To achieve this, get the vertical distance at the frequency where Bode phase plot is equal to 180° between the magnitude curve on the Bode magnitude plot and the x-axis.
The phase crossover frequency is at that point.It’s important to understand that the Gain & the Gain Margin are two different terms. In practical terms, the gain margin (measured in decibels, or dB) is the opposite of the gain. When examine the Gain margin calculation, this will render formula.
Formula for Gain Margin
Gain Margin (GM) formula may be written as follows:
GM = 0- G dB
Where,
G is the gain
The magnitude (in dB) is taken from the magnitude plot’s vertical axis at the phase cross-over frequency.
Phase Margin
The stability of the system will increase with the Phase Margin (PM) value. The amount of phase that may be raised or reduced without the system becoming unstable is referred to as the phase margin. Typically, it is described as the phase in degrees.
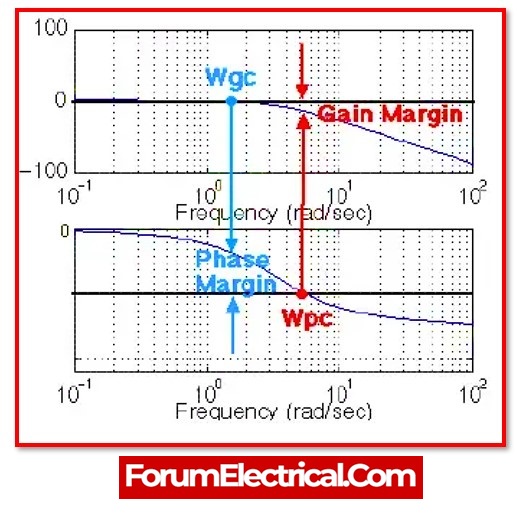
Usually, the Bode plot be used to directly consider the phase margin. In order to accomplish this, get the vertical distance at the frequency where the Bode magnitude plot equals 0 dB between the phase curve & the x-axis. This point is called as the gain crossover frequency.
It’s important to understand that the phase lag & the phase margin are two distinct terms.
Phase Margin Formula
Phase Margin (PM) formula may be written as:
PM =ø – (- 1800)
Where,
ø is the phase lag, which is a value smaller than 0.
This is the phase as determined by the gain crossover frequency’s vertical axis of the phase diagram.