
Power System Engineers focus a high priority on modelling and simulation tools. Engineers must constantly utilise these types of software to analyse and verify their designs before to real execution. Before installing the system, software is utilised for different assessments such as
- Cost-benefit analysis,
- Feasibility analysis,
- Protection coordination, and so on.
Electrical engineers test their suggested designs using industry standard software.
The use of ETAP for power system modelling, design, and analysis serves as the basis for this and will be presenting the fundamental user interface of ETAP, as well as its functionality and several features that might be beneficial for modelling and analysing power systems.
ETAP – Electrical Transient Analyzer Program
The Operation Technology Inc. (OTI) development team created the ETAP full-spectrum analytical engineering software. The programme that is specifically designed for the purpose of analysing, simulating, monitoring, controlling, perfecting, and automating electrical power systems.
The ETAP software delivers the most complete & integrated collection of power system solutions, spanning all aspects of the power system, from modelling through operation.
Overview of the Features of the ETAP
The ETAP Software is among the most effective electrical transient analysis programmes accessible, and it features a user-friendly interface that enables users to carry out detailed analyses on electrical power systems.
Integration with Microsoft excel is only one of many incredible features that this programme possesses.
The ETAP Software features a simulation setting that is both simple and user-friendly, and it comes with a complete user manual that guides users through any problems that may arise while they are simulating. The figure that follows shows ETAP’s Basic interface in all of its components.
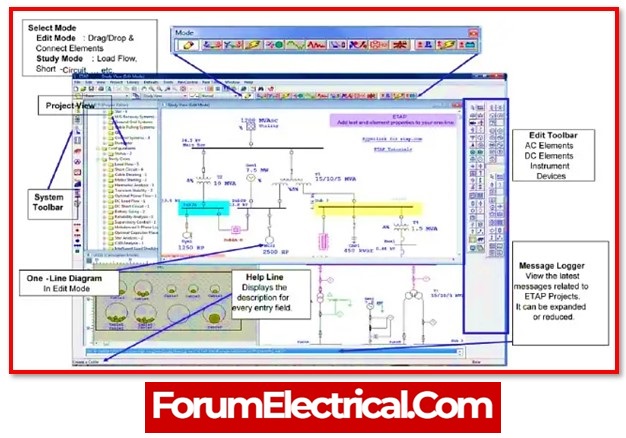
ETAP – Toolbar
The functioning of the various toolbars in the ETAP programme has been thoughtfully considered and accounted for in the software’s design. When the user is generating a one-line diagram of a power system model, they have simple access to all of the toolbars. In addition to the toolbars, there are a variety of other options available to do examines on the system model. These options include study cases, settings, and edit toolbars. This article goes into detail about each and every one of them.
Mode – Toolbar

As can be seen in the diagram, ETAP contains a total of 13 different study modes. Following is an overview of each of them in the following order, moving from left to right:
- Load Flow: Used to perform load flow (or power flow) on power system modelled in single line diagram.
- Unbalanced Load Flow
- ANSI Short Circuit Analysis
- Motor Starting Analysis
- Harmonic Analysis
- Transient Analysis
- Star Protection Coordination
- Optimal Load Flow
- Reliability Analysis
- Optimal Capacitor Placement
- DC Load Flow
- DC Short Circuit Analysis
- Battery Sizing Analysis
Analysis Toolbar
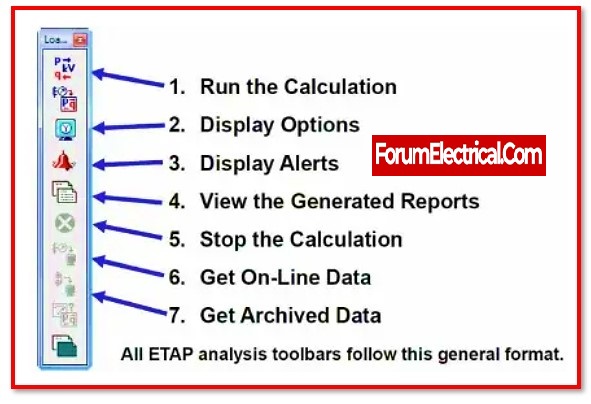
Once the Load Flow Mode has been selected, as is illustrated in a clear manner from the toolbar above, are able to pick any option from it’s Analysis Toolbar in order to perform the load flow calculations, view results and alterations, produce and export report, and even gather live data from an actual power system.

Features of ETAP
- Monitoring on many screens and consoles simultaneously
- Graphical monitoring accomplished by the use of an ETAP one-line diagram
- Visual monitoring accomplished through the use of the Man-Machine Interface (MMI).
- Notification of alarms using a graphical user interface
- Warning, there have been breaches with the equipment.
- Surveillance of both electrical and non-electrical operating characteristics
- (Take precedence over) measured data are replaced by pseudo measurements.
- Interface layer for OPC
- tiers of access for users
- Constant and accurate monitoring in real time
- Retrieve information whenever it’s needed
- Reconciling the data and making sure everything is consistent
- Detection and repair of inaccurate data
- Administration of alarms and data processing
- Accounting for and monitoring of energy costs
- Forecasting and tracking of real-time load in real time
Experiment Example
- Start ETAP.
- This step could require a few minutes depending on the machine.
- Go to select “Example ANSI” from the “menu/open” command.
- When requested for a user name, click “Ok.” as well as “OK” for Project Editor.
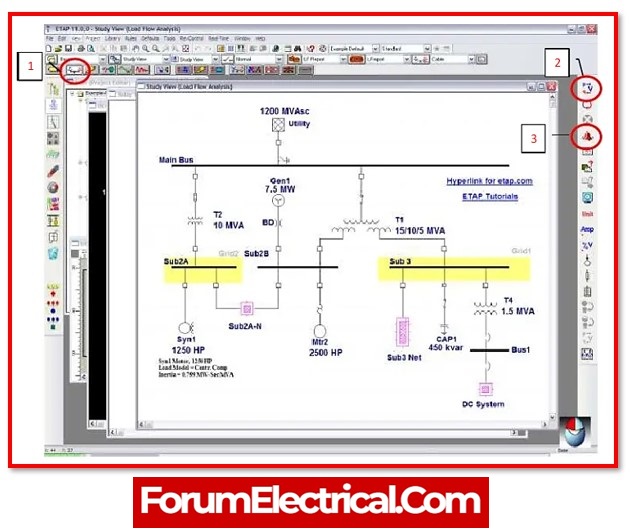
- Can see a window similar to the one shown in figure.
- By pressing the “1” button, enter the Load Flow Analysis mode.
- Click the “2” button to start the Load Flow Analysis.
- To view the units, click the “Unit” button.
- To see critical errors, choose “Alert View” (button “3”) and then “Critical…”
- Sub3 Bus is at 106%”, “Fuse3 is at 113.6%” should be displayed.
- These major mistakes may cause the power system to fail.
- Double-click “Fuse3” to bring up the “SubNet 3” diagram and find the “Fuse3 (442 A)”.
- Modify the fuse value to the value that estimate it should be by double-clicking the fuse and going to ratings.
- Click “Ok” when everything is in order.
- Return to “Study View” and repeat the Load Flow exam.
- Examine the generated warning.
- If the value chosen for the “Fuse3” is correct, the warning should be removed.
- Correct the “Sub3 Bus” problem using the same method.
- Return to the “Study View” and choose Short Circuit Analysis.
- Perform the “3 phase device duty” test.
- After the test, go to the “Alert view” to go through the errors that were created.
- Change the circuit settings to eliminate critical faults.
- Execute the “Arc flash” test, review the warnings, and adjust the circuit parts to clear them.
- Close ETAP.
Summary
This post will give a fundamental introduction to ETAP, including an overview of the program’s capabilities and features. In the following, initially construct its single line diagram before proceeding to perform an analysis of the system’s load flow.
